An introduction to LaminR  
Any data scientist will tell you that a key to a successful project is strong data management. If your data are disorganized, you don’t know who did what, or you can’t reproduce results, it will come back to bite you and your team. Thus, teams should carefully plan how they handle, store, modify, and track data throughout a project. Here, we’ll be using an example from single-cell analysis to illustrate how the open-source LaminR package helps with traceability and reproducibility of data analyses in R.
The devil is in the details, in particular when working with many complex datasets. You might have multiple data scientists and agents manipulating the data in multiple ways. Did we do a log1p transform or an asinh transform? Did we center and scale the data? I see some clusters. How did we cluster? Did we use the default parameters or change something? And so forth. Furthermore, revisiting older projects can be a nightmare when the original authors have moved on. Yet, these projects can be treasure troves that provide crucial context and training data for AI agents.
It doesn’t matter how good your AI foundation model is if your datasets and infrastructure are problematic. It boils down to the classic adage: ‘garbage in, garbage out.’ So how do we handle all of this, aside from hiring a team of data engineers? This is where LaminR helps. LaminR is an open-source package designed to solve the data infrastructure challenges that naturally arise when large teams and AI agents collaborate on massive datasets. In particular, LaminR manages metadata to allow querying and finding data, and it tracks every line of code that modified a data object, including who made the change and when. So if a data scientist has to revisit an old dataset or one they did not work on, they’ll have the information they need.
PBMC 3k
To illustrate this, we use the well-known PBMC 3k dataset. This dataset has been featured in Seurat’s guided clustering tutorial for a decade, and is still the common entry point for single-cell RNA sequencing analysis.
If you have access to a hosted LaminDB instance on lamin.ai, you can log in and connect to it:
lamin login username
lamin connect instance_owner/your_instance
lc <- laminr::import_module("lamin_cli")
lc$login(user = "username")
lc$connect("instance_owner/your_instance")
If you want to initialize your own database instead, use:
lamin init --storage ./mydata --modules bionty
lc <- laminr::import_module("lamin_cli")
lc$init(storage = "./mydata", modules = "bionty")
LaminR is based on the Python package LaminDB and reticulate. To set things up in your script or Rmd notebook, run the following:
library(laminr)
ln <- laminr::import_module("lamindb")  # `ln` is the central object, equivalent to Python's `lamindb`
Importantly, you typically want LaminR to track what you do, so all datasets will be linked to the generating code:
ln$track() # start a tracked run of your script or notebook
From here, you load the PBMC 3k dataset and take it through whatever analysis you’re going to do, e.g., a standard pre-processing → PCA → clustering → nonlinear dimensionality reduction setup:
library(Seurat)
library(SeuratData)
cells <- SeuratData::LoadData("pbmc3k")
cells <- NormalizeData(cells, normalization.method = "LogNormalize", scale.factor = 10000)
cells <- FindVariableFeatures(cells, selection.method = "vst", nfeatures = 2000)
all.genes <- rownames(cells)
cells <- ScaleData(cells, features = all.genes)
cells <- RunPCA(cells, features = VariableFeatures(object = cells))
cells <- FindNeighbors(cells, dims = 1:10)
cells <- FindClusters(cells, resolution = 0.5)
cells <- RunUMAP(cells, dims = 1:10)
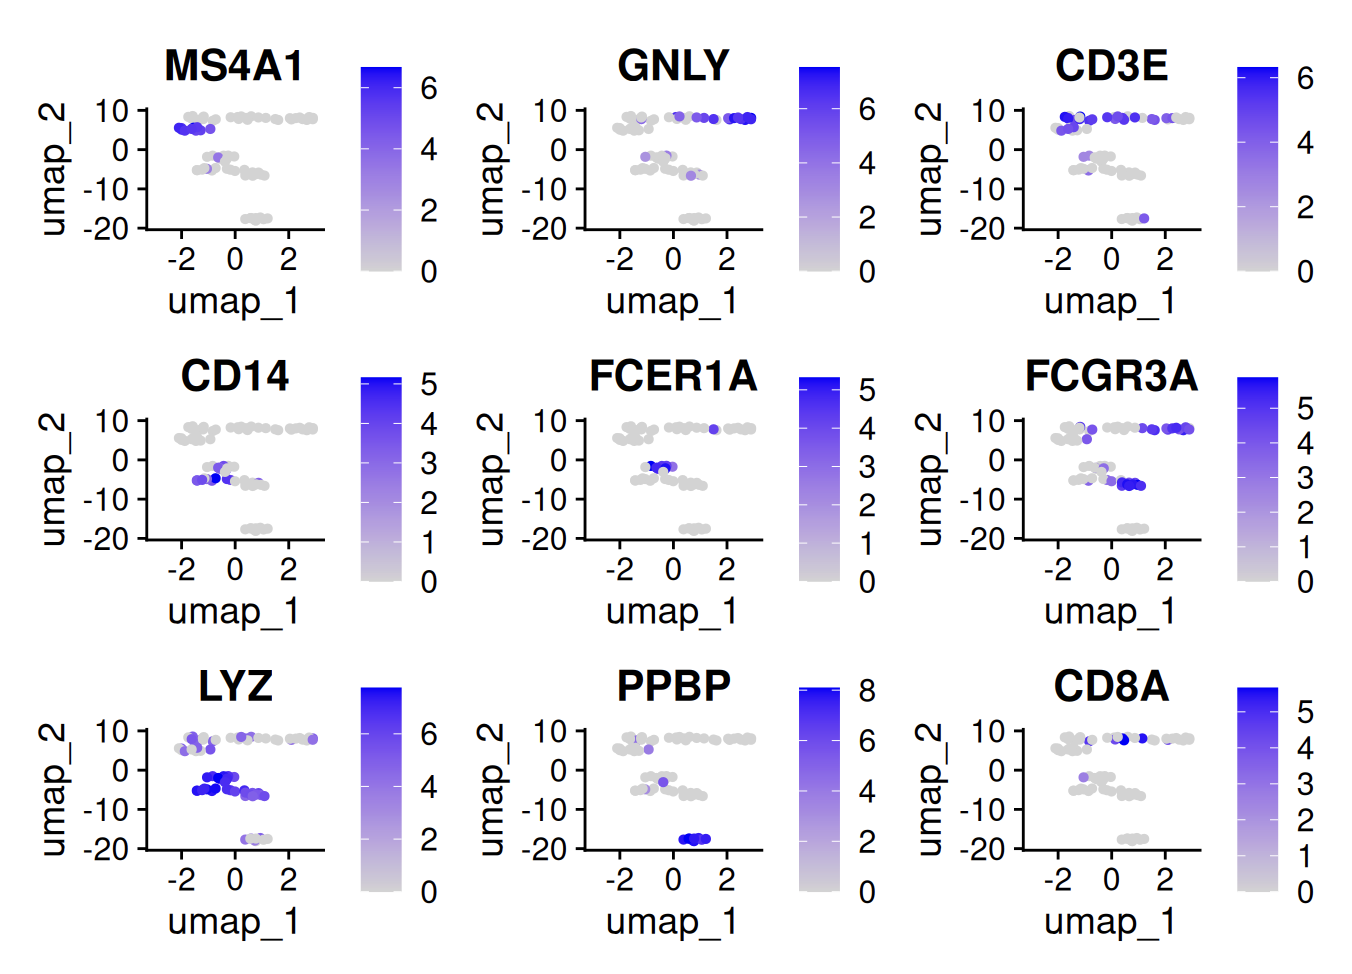
FeaturePlot(cells, features = c("MS4A1", "GNLY", "CD3E", "CD14", "FCER1A", "FCGR3A", "LYZ", "PPBP", "CD8A"))
Let’s save this Seurat object as an artifact in LaminR:
saveRDS(cells, "pbmc3k_processed.rds")
ln$Artifact("pbmc3k_processed.rds", key = "pbmc3k/pbmc3k_processed.rds")$save()
And end the compute session:
ln$finish()
If you use notebook mode in RStudio, this will automatically upload a run report. Otherwise, you can knit your notebook and run one of the following to save the knitted HTML:
lamin save pbmc3k.Rmd
lc$save("pbmc3k.Rmd")
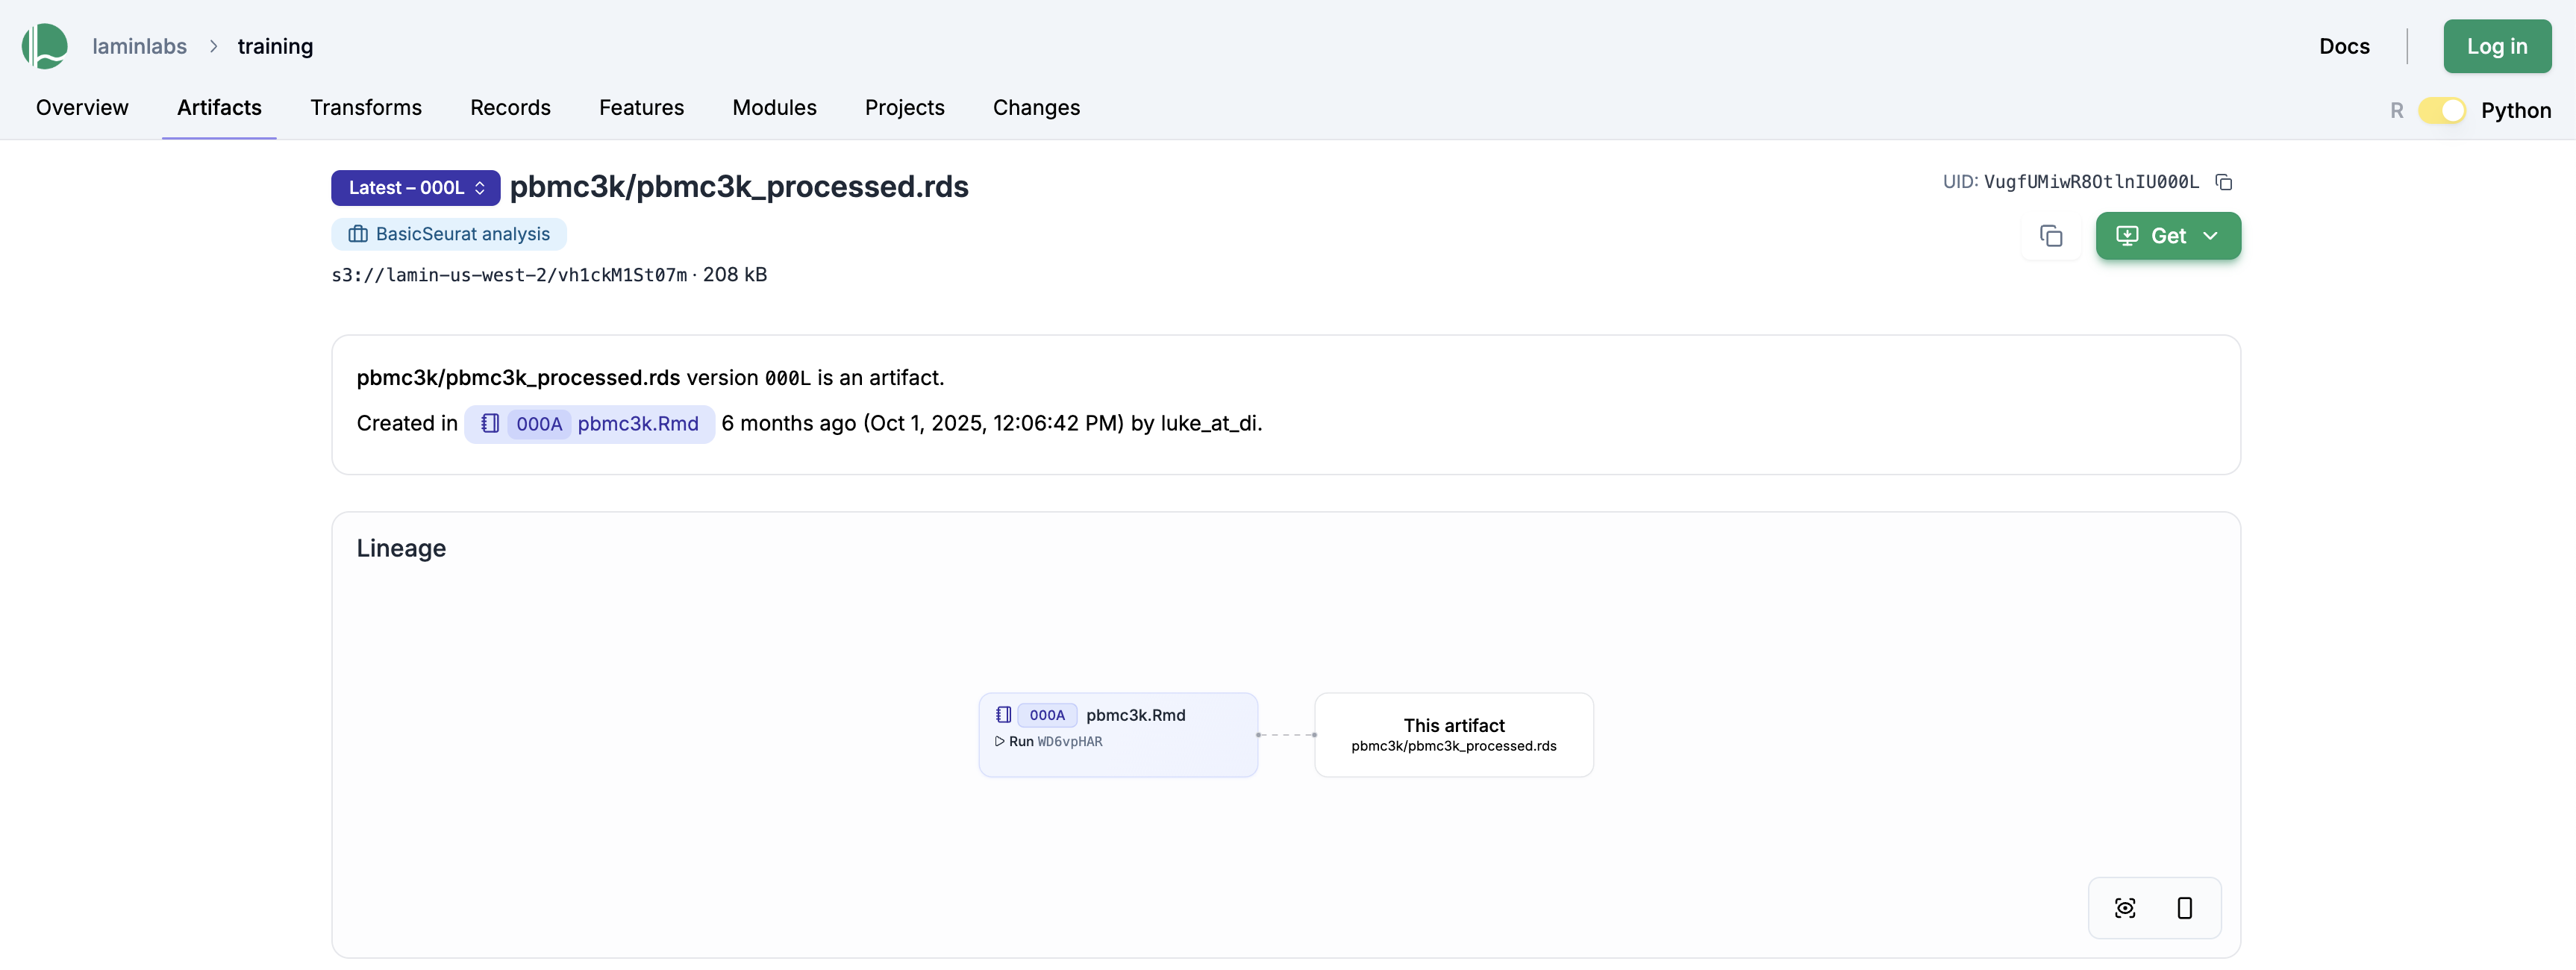
The above saves the pbmc3k.Rmd notebook as a “transform” (shorthand for data transformation), linking it against the output file pbmc3k/pbmc3k_processed.rds. This is also visible on the LaminHub GUI on the artifact page: lamin.ai/laminlabs/training/artifact/VugfUMiwR8OtlnIU
Clicking on the pbmc3k.Rmd notebook gives us the run report, which contains all plots and results:
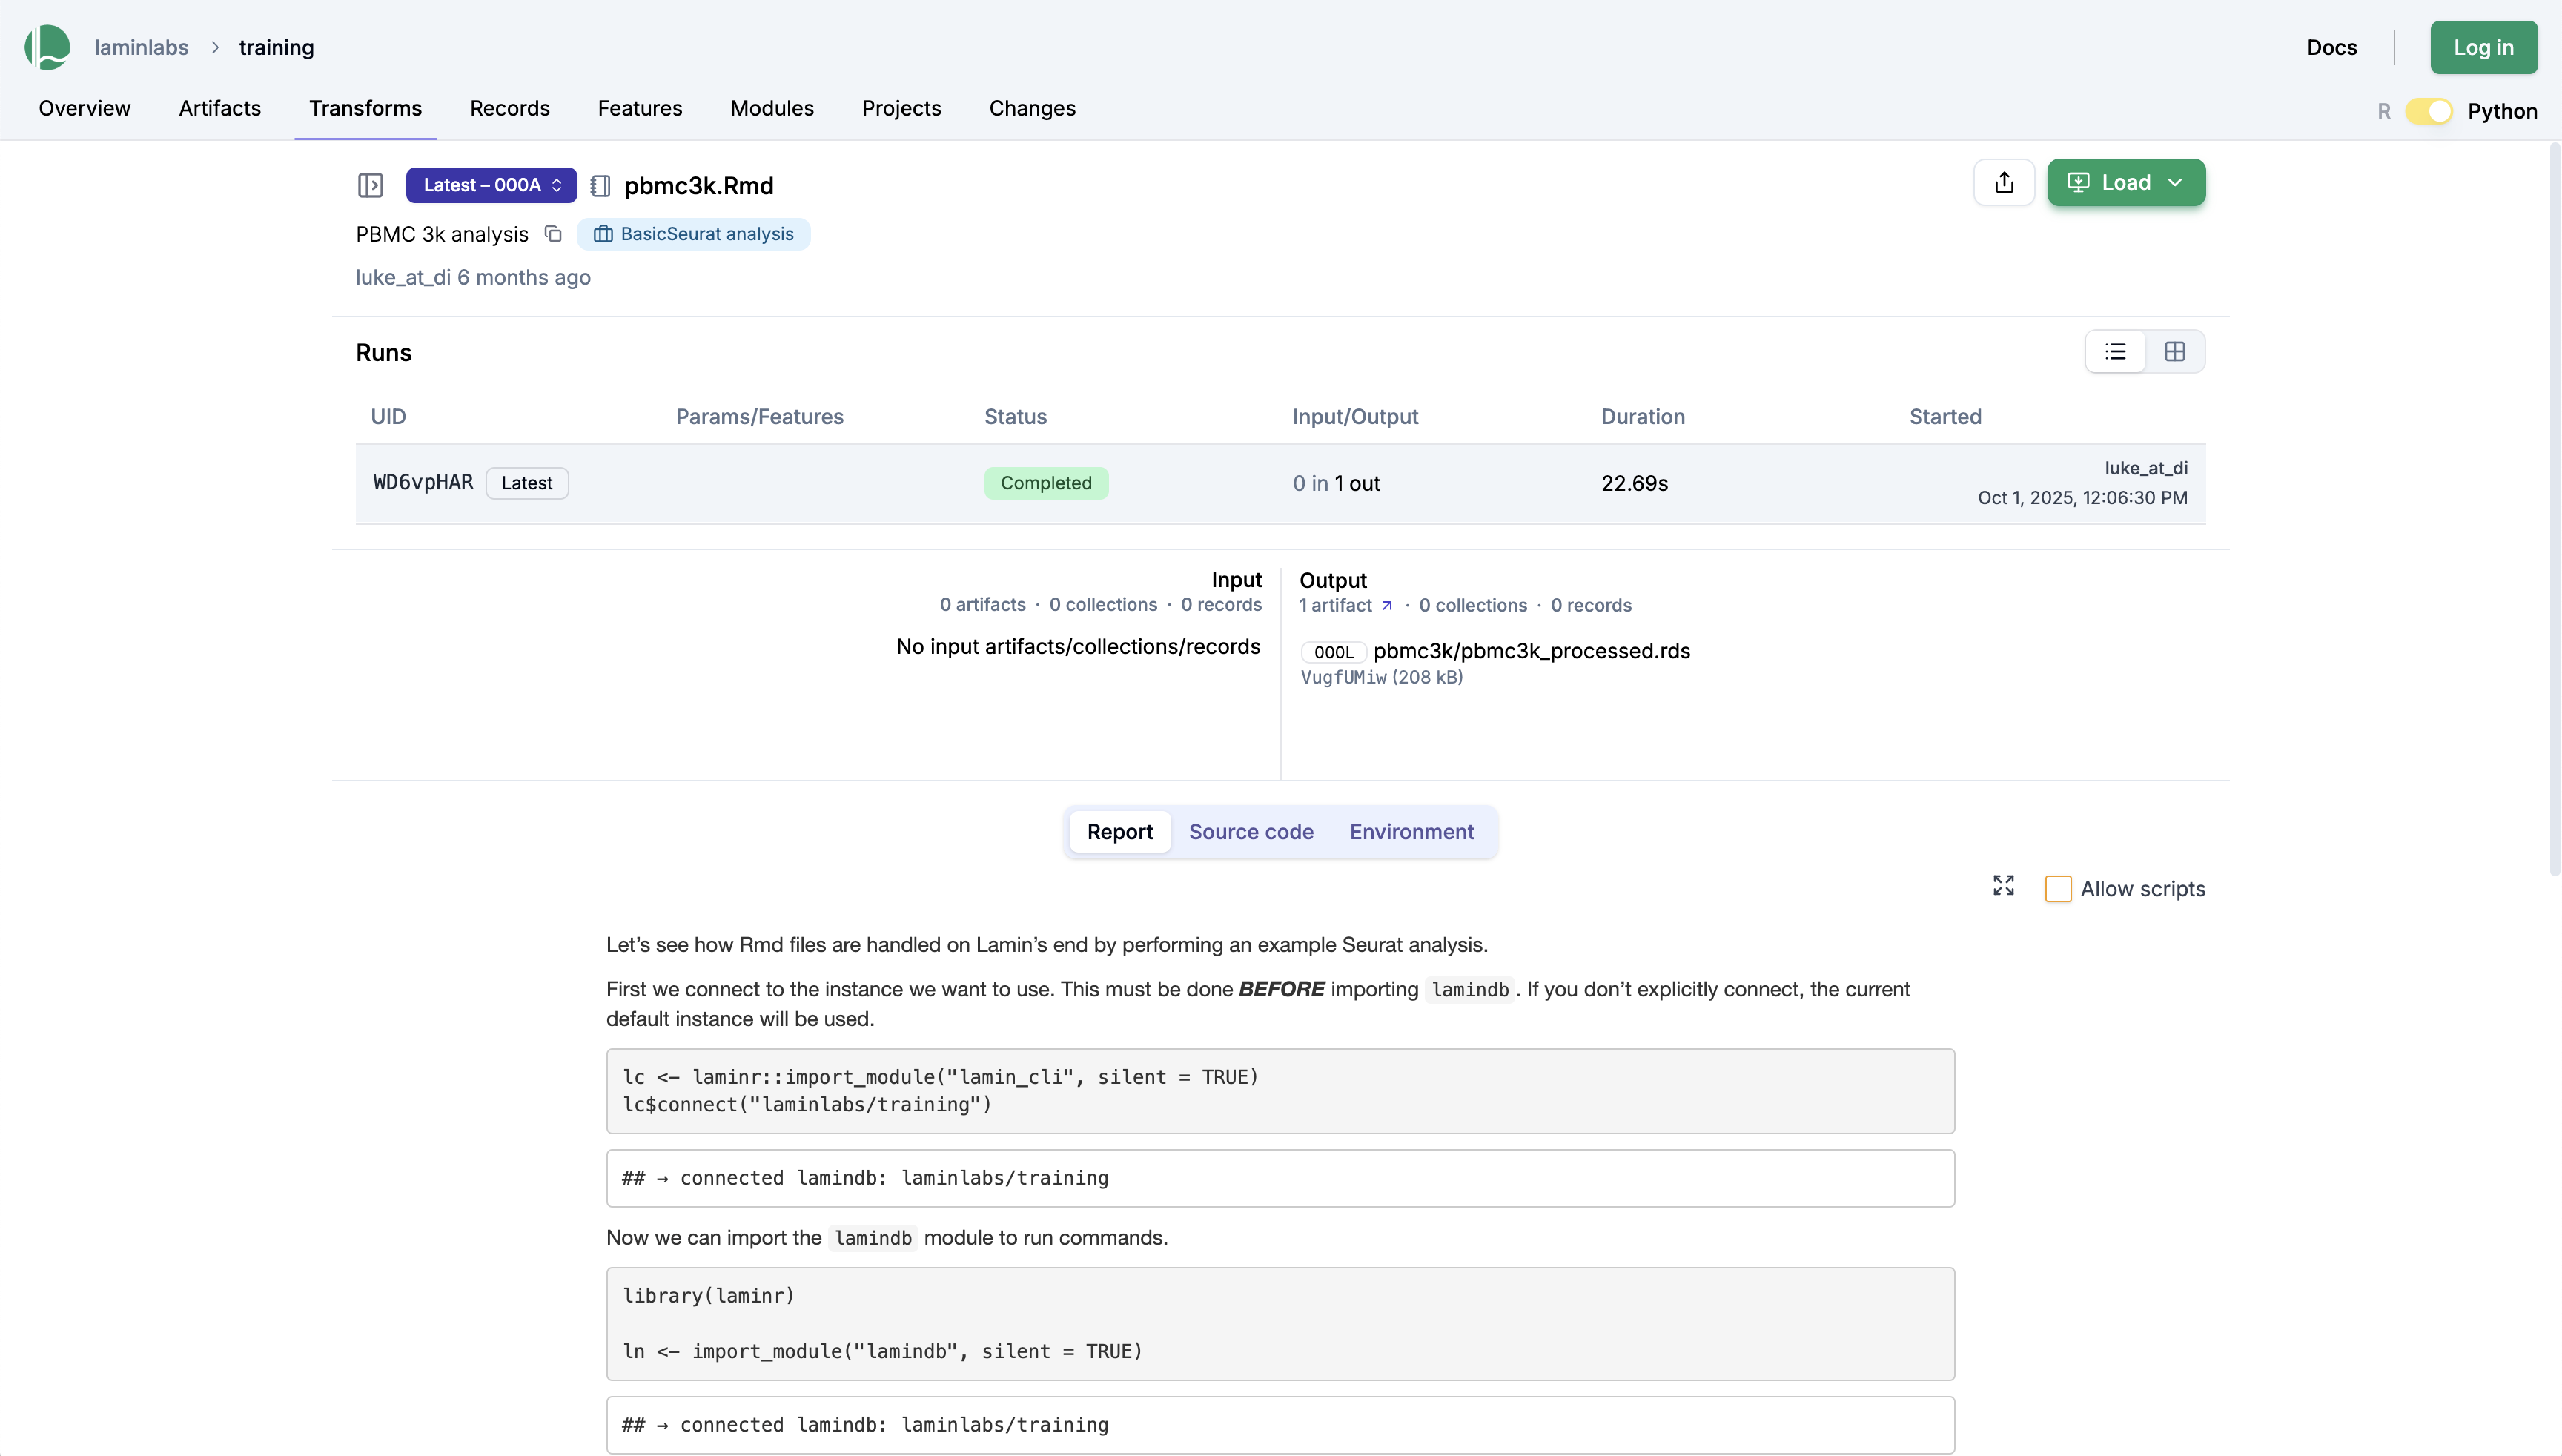
To share this notebook, you can send colleagues a persistent link to the transform page: lamin.ai/laminlabs/training/transform/KFtlfbCiP9Bm.
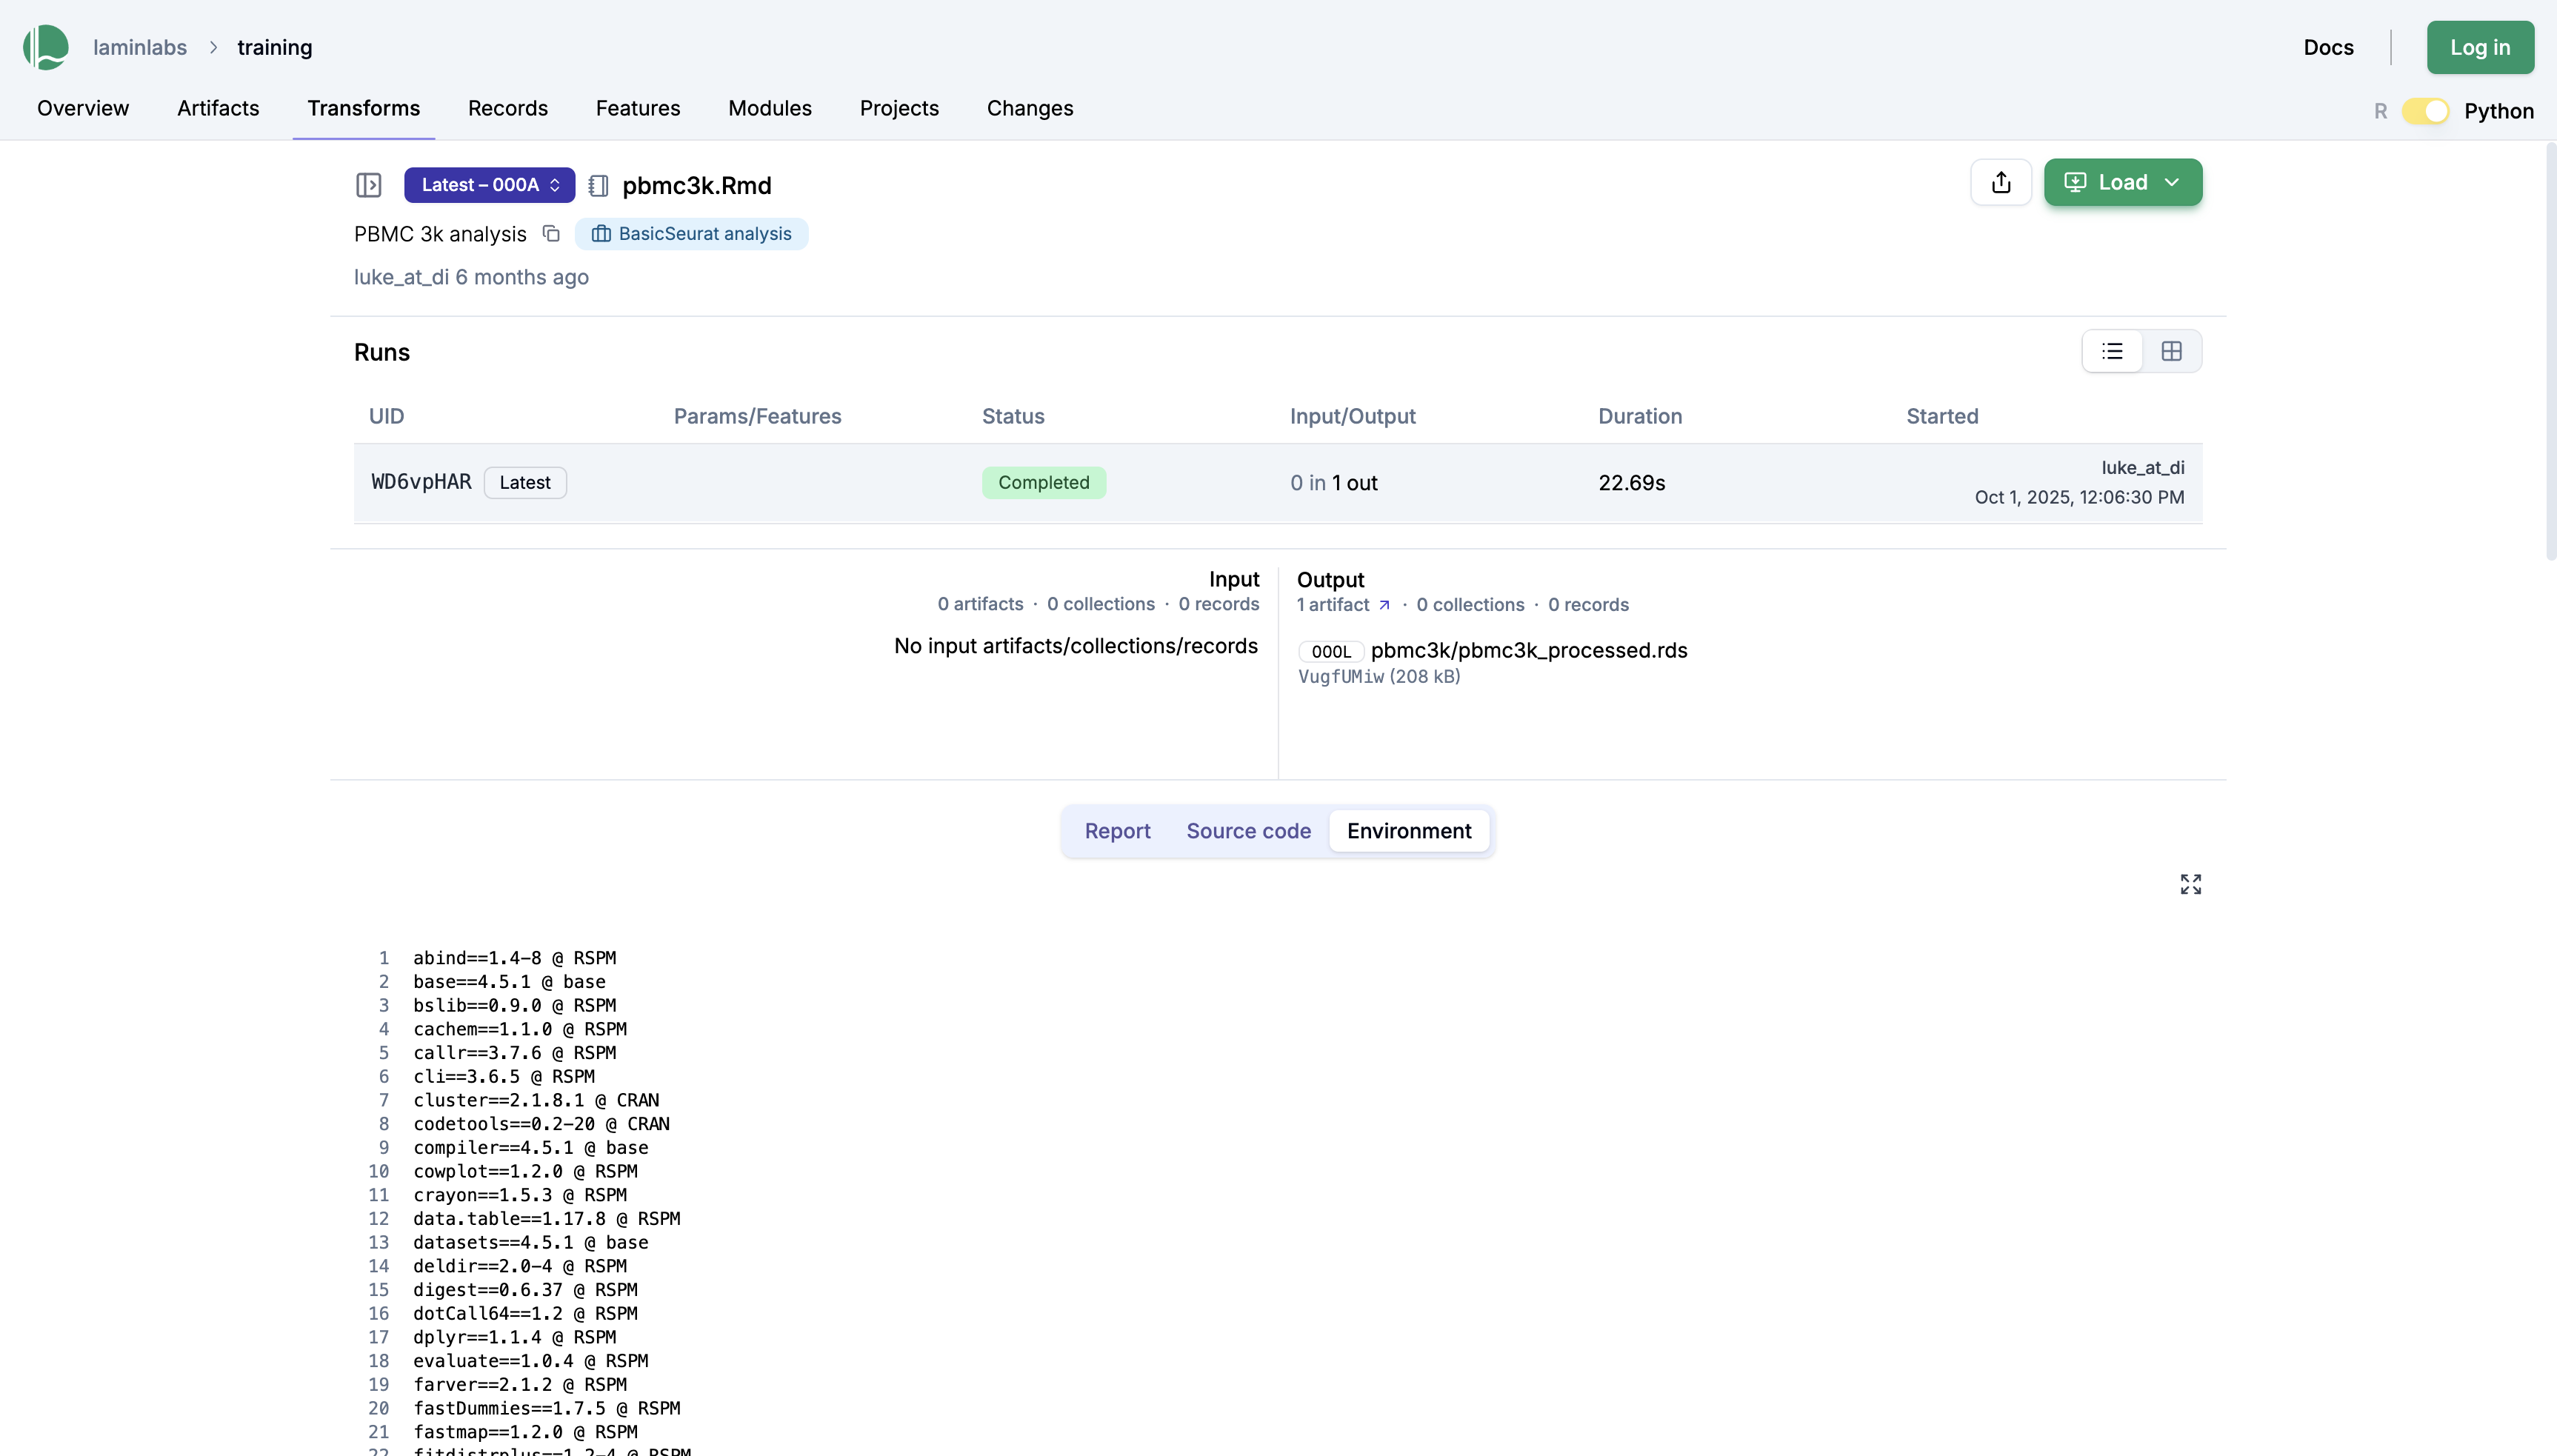
Beyond inputs and outputs, this page also shows the environment—specifically, the packages that were loaded at the time of running the script:
Every unit of work that you do can now be easily shared and communicated, both with colleagues and your future self. For a given piece of data, every manipulation and its surrounding code are now recorded and stored, making it easier to understand and reproduce.
To learn more, take a look at the docs or the source code:
The docs: https://docs.lamin.ai
The LaminR source code: laminlabs/laminr
The LaminDB source code: laminlabs/lamindb
Acknowledgements
Thanks to Luke Zappia and Robrecht Cannoodt for creating LaminR and to Alex Wolf for editing this post.
Disclosure
Lamin engaged Tyler to illustrate a simple introductory use case for LaminR. This blog post is the result of that engagement.